Requirements for Shared Data
Last updated: August 17, 2026
Introduction
To get the most accurate and actionable insights, we need clean, complete, and properly formatted data. This guide explains how to share your data with us, including the formats we can accept, the fields we require, and examples of what good data looks like.
Following these guidelines helps us process your data faster, avoid delays, and ensure the analysis reflects your business accurately. Think of it as setting the foundation— the better the input, the stronger and more reliable the results we can deliver.
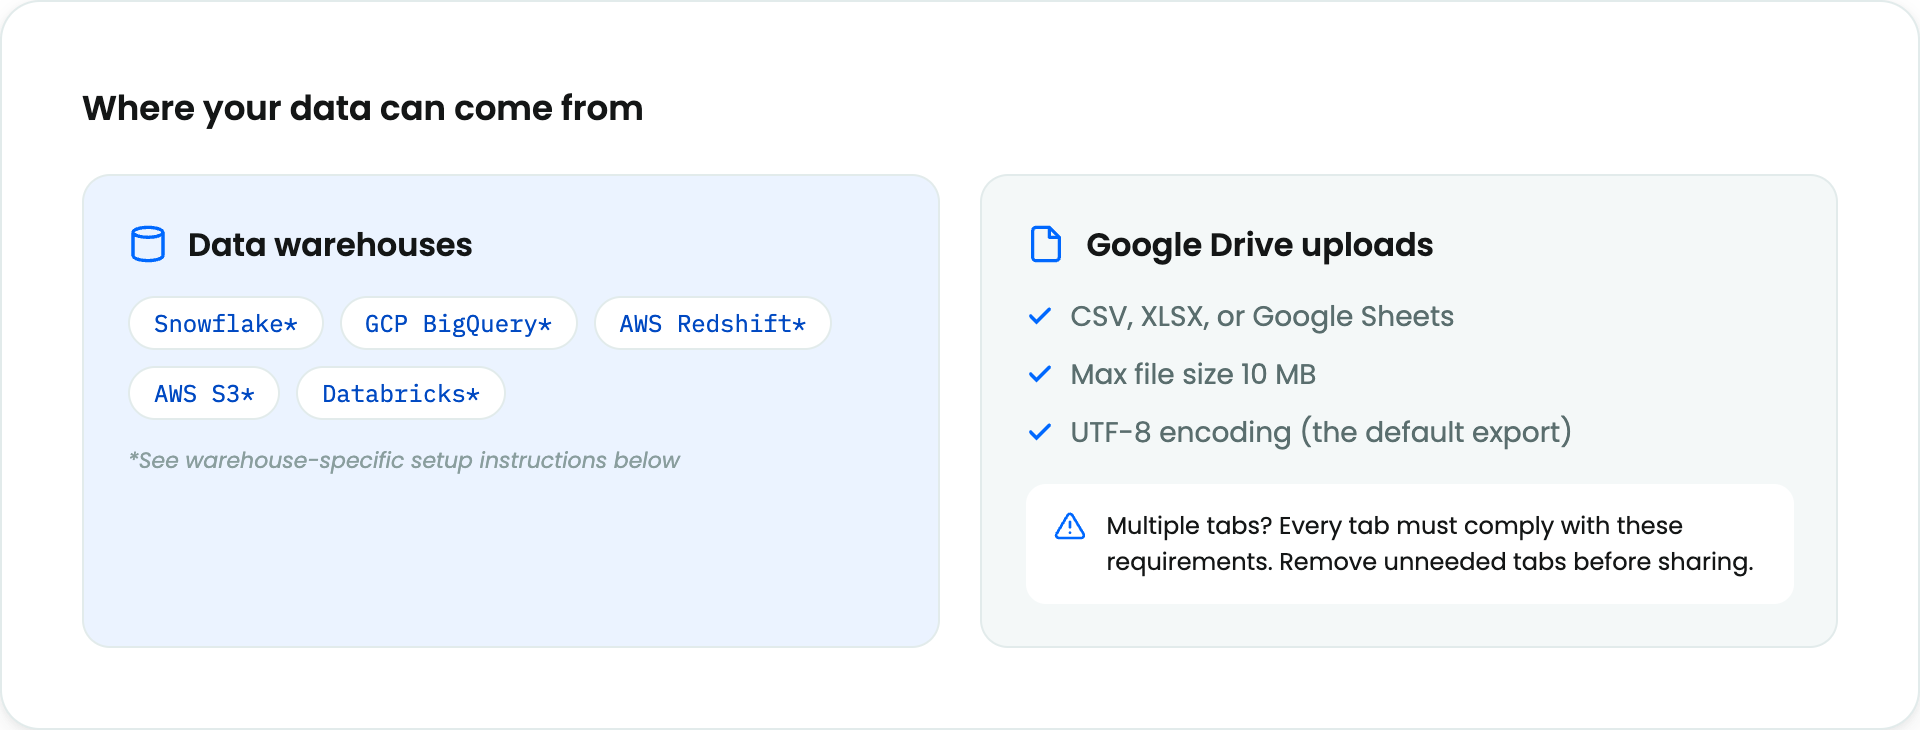
Data Warehouses Instructions
Special Cases
Hierarchical vs. Non-Hierarchical Models
We build non-hierarchical models for most of our customers — i.e. models where the data used is aggregated across geographical regions. For some customers, however, we are building a hierarchical model. In these cases, all of the data (input and target metrics) are broken out by geographical region.
This document explains what your data should look like for a non-hierarchical model. It can be adapted for hierarchical models by adding a “region” column to each table in your dataset. This column is required and is added to the uniqueness dimensions — for example, if a dataset is unique by (date, campaign_name) in a non-hierarchical model, it will be unique by (region, date, campaign_name) in a hierarchical model.
For hierarchical models, when possible you should use the same regions in your dataset as you intend to use for your model. In rare cases this won’t be the case — for example, your data might have 100 regions, but we are modeling only 5 (macro) geographical regions. In these cases, you should provide a simple mapping table that associates the regions from the data with the macro regions to be used for modeling. It should meet the following schema:
Unique by: N/A
macro_region
region
NAMER
US
NAMER
MX
NAMER
CA
EMEA
GB
…
…
Single vs. Multiple Products / SKUs
In most cases, Paramark builds one or more models for a single product for a customer. For example, we might be building two models on the same dataset, only with different target metrics. The schemas mentioned in this document are written for this use case and can be used as is.
Sometimes, however, we are building different models for different products. For example, you might have two lines of business with different marketing campaigns and business metrics. For these cases, you have two options:
(preferred) provide two different datasets, one per product. In this case, you don’t need to make any changes to the schemas documented here.
(also supported) adapt the schemas in this document by adding a “product” column to each table in your dataset. This column is also added to the uniqueness dimensions — for example, data that is unique by (date, campaign_name) in a single-product case becomes unique by (product, date, campaign_name).
Combining marketing channels / business KPIs
In Supported Data Schemas, we assume that each marketing channel or business KPI will have its own data source. Most of our customers choose this option.
If you prefer, you can also combine multiple marketing channels or business KPIs into a single data source. To do this, you make two changes to the documented schema:
add a column for marketing channel or business KPI
add that column to the "unique by" list
For example, here's what the "Account level with Spend" schema looks like when we combine multiple marketing channels into a single data source:
Unique by: date, channel_name
date | channel_name | impressions | spend |
2025-01-01 | Events | 151222 | 2500.00 |
2025-01-01 | Linear TV | 132621 | 2100.00 |
2025-01-02 | Events | 165780 | 2750.00 |
2025-01-02 | Linear TV | 149390 | 2620.00 |
... | ... | ... | ... |
Data Requirements
General Requirements
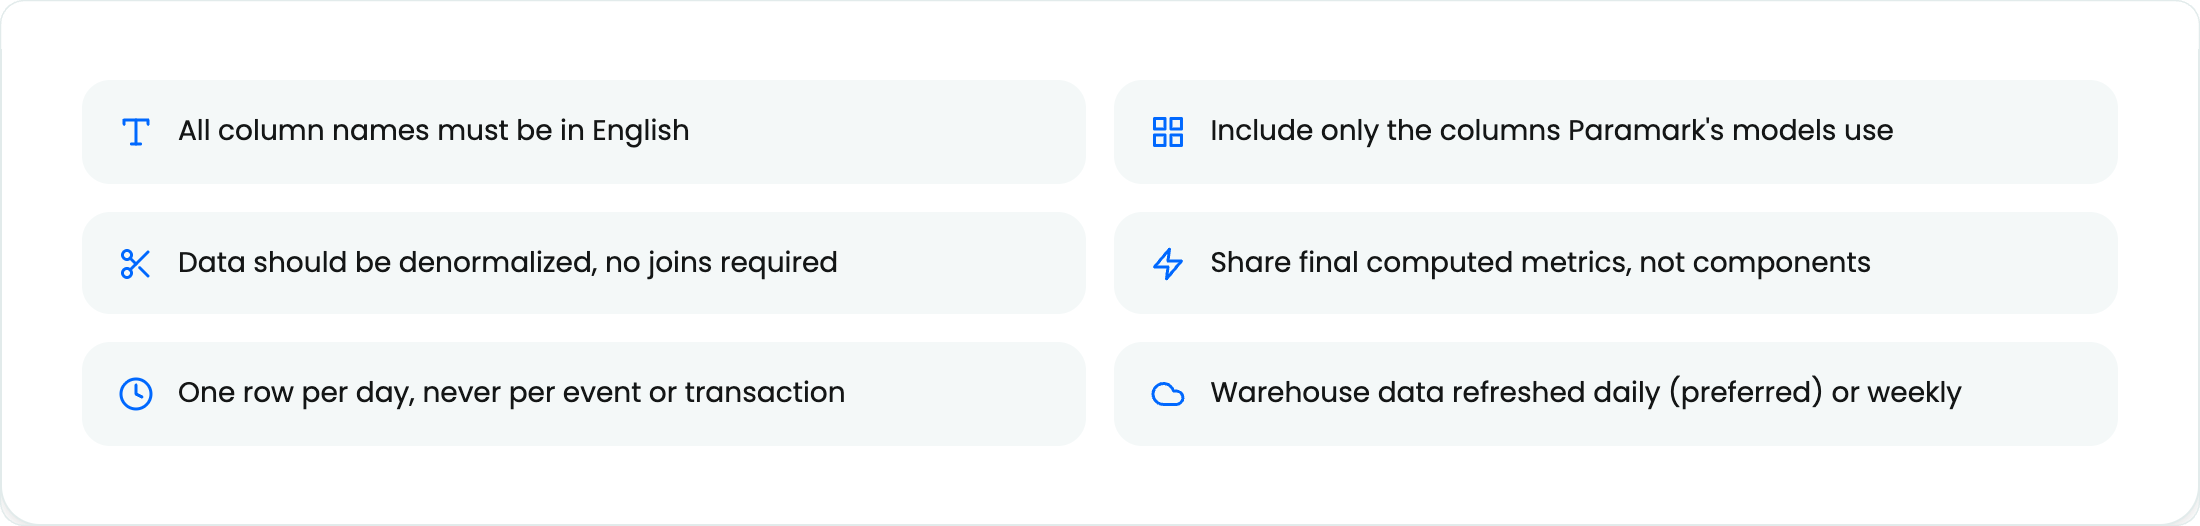
Examples of common mistakes:
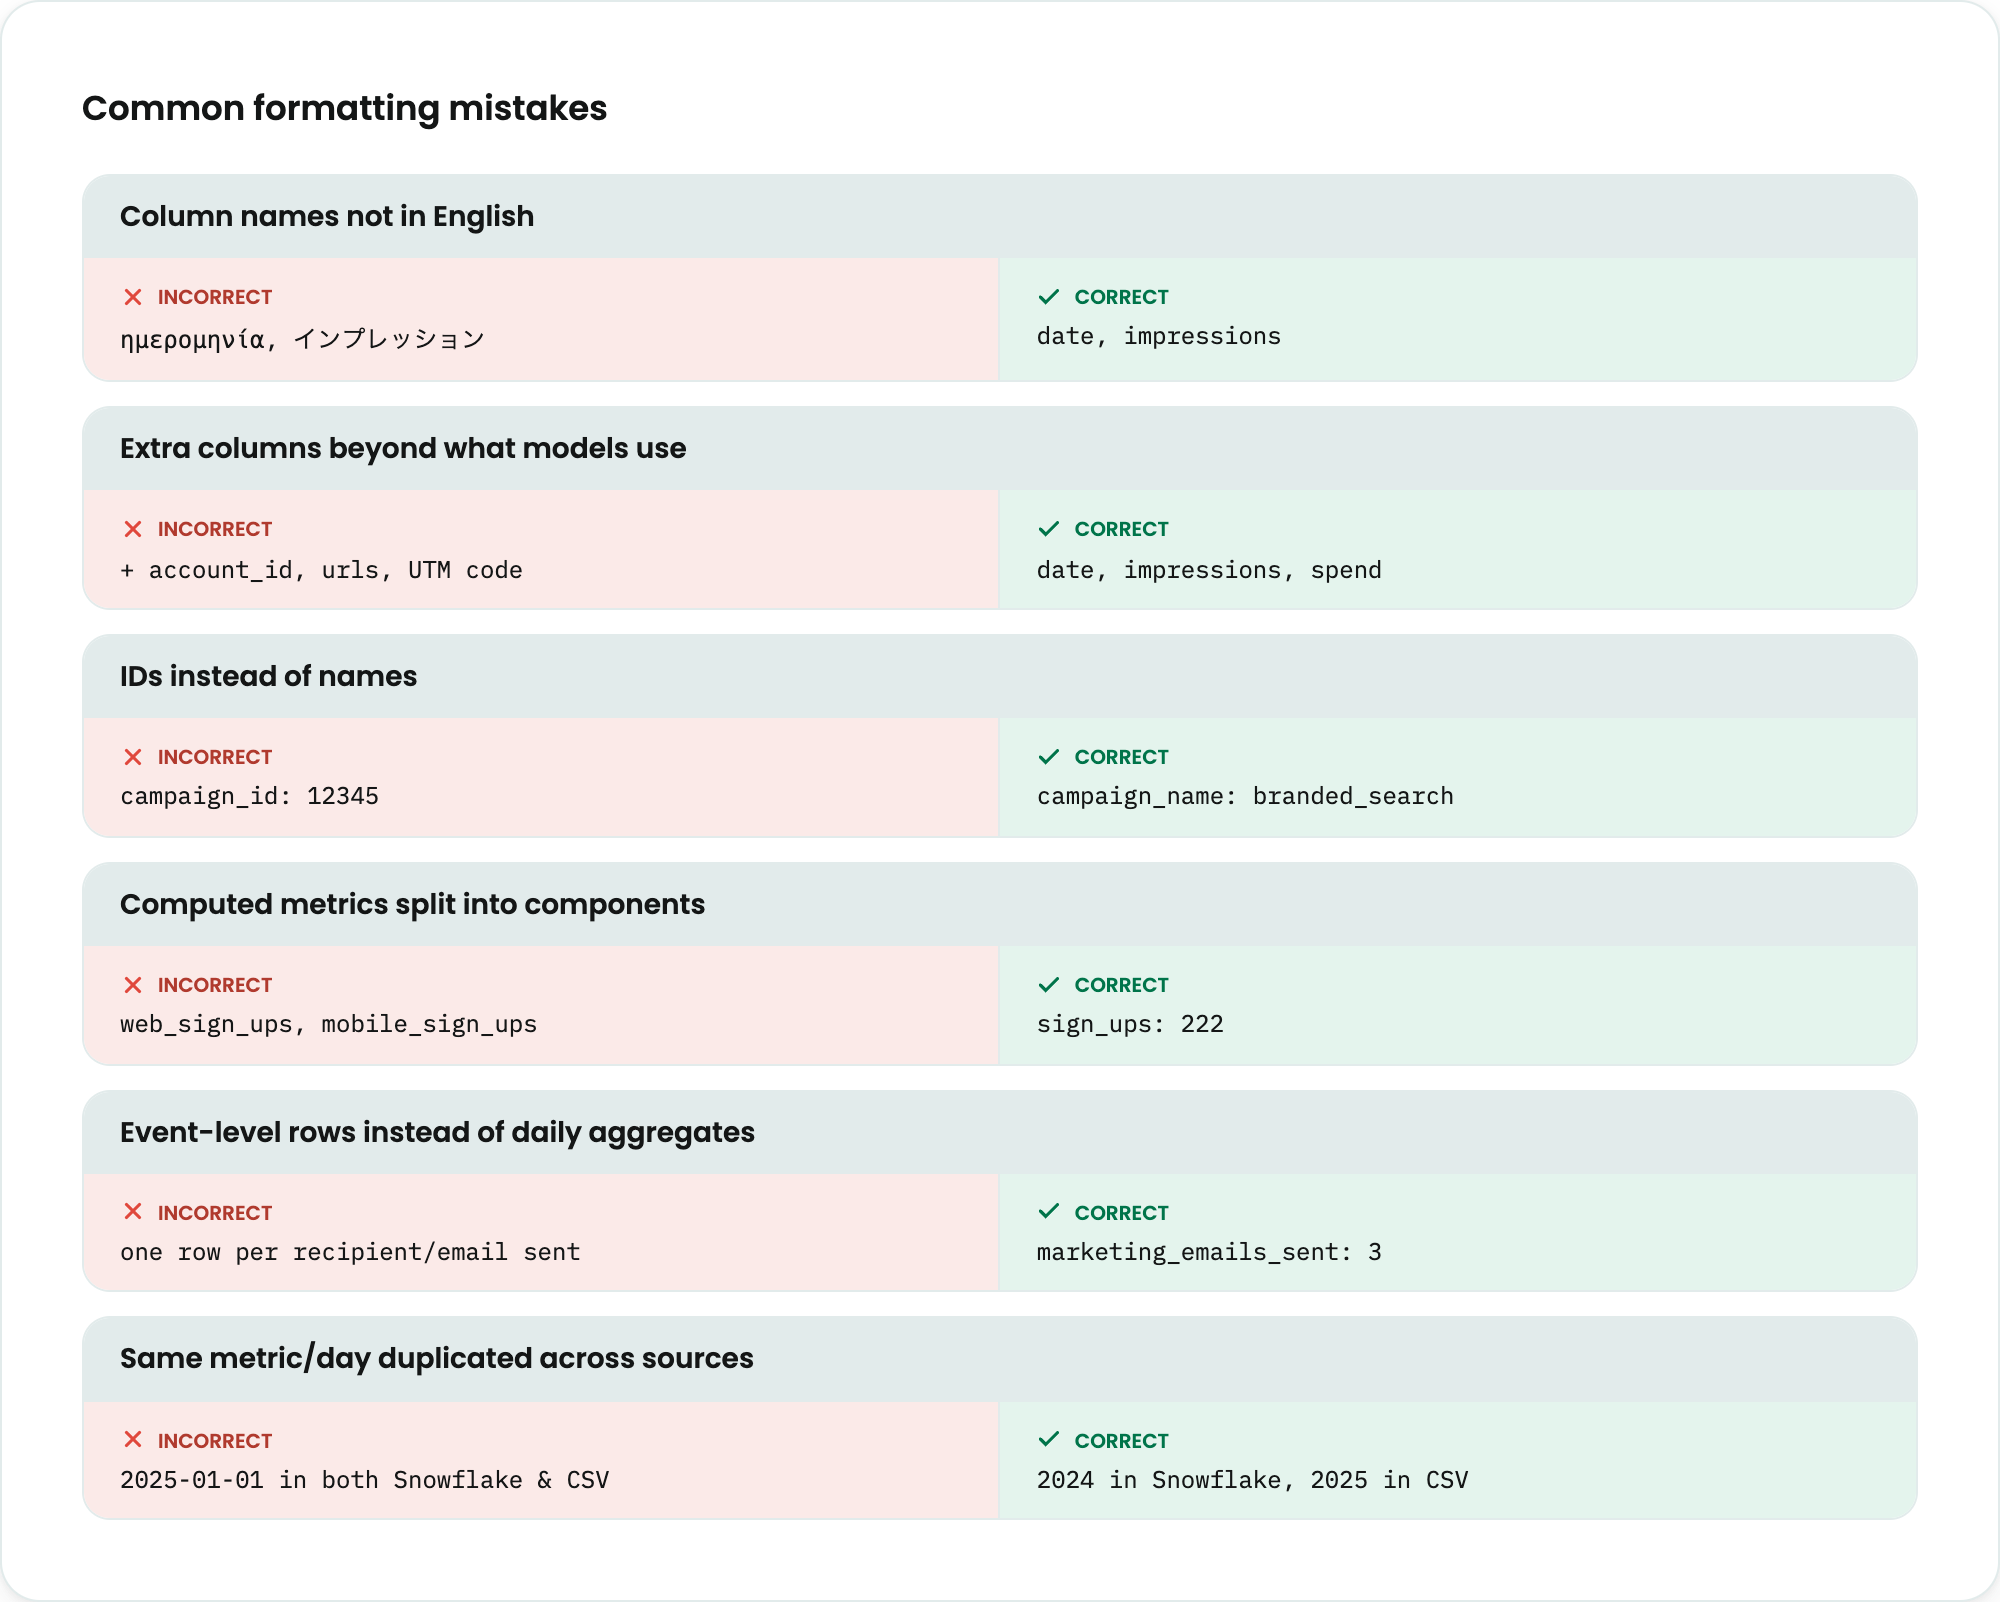
Example: Columns in English
❌ Incorrect:
ημερομηνία (date) | インプレッション (impressions) | 지출 (spend) |
✅ Correct:
date | impressions | spend |
Example: Include only columns Paramark will use
❌ Incorrect:
date | impressions | spend | account_id | urls | UTM Code |
✅ Correct:
date | impressions | spend |
✅ Correct (campaign data):
date | campaign_name | impressions | spend |
✅ Correct (Google data):
date | channel_type | campaign_name | impressions | spend |
Example: Data should be denormalized and no filtering/joins required
❌ Incorrect:
campaign_id | campaign_name |
12345 | branded_search |
date | campaign_id | impressions | spend |
2025-01-01 | 12345 | 50,000 | 1,200 |
✅ Correct:
date | campaign_name | impressions | spend |
2025-01-01 | branded_search | 50,000 | 1,200 |
Example: Show final computed metric, not component metrics
❌ Incorrect (for a target metric of total signups):
date | web_sign_ups | mobile_sign_ups |
2025-01-01 | 100 | 122 |
✅ Correct:
date | sign_ups |
2025-01-01 | 222 |
Example: One row per day not per transaction
❌ Incorrect (e.g., marketing emails):
date | recipient | subject |
2025-01-01 | hi pete | |
2025-01-01 | would you like a free sample? | |
2025-01-01 | how to improve your health in three easy steps |
✅ Correct:
date | marketing_emails_sent |
2025-01-01 | 3 |
Data for a given metric, for a given day, should not be duplicated across data sources. This means:
❌ Incorrect
Webinars registrations data for 2025-01-01 is in both a Snowflake table and a CSV file.
✅ Correct:
Webinars registrations data for 2024 is in a Snowflake table, while Webinars registrations data for 2025 is in a CSV file.
Supported Data Schemas
Your data must conform to one of the following schemas, depending on type, granularity, and aggregation level.
Note: We generally use impressions as the input metric for your marketing channels. If your marketing channel does not have impressions, consult with your Growth Advisor to find a suitable alternative.
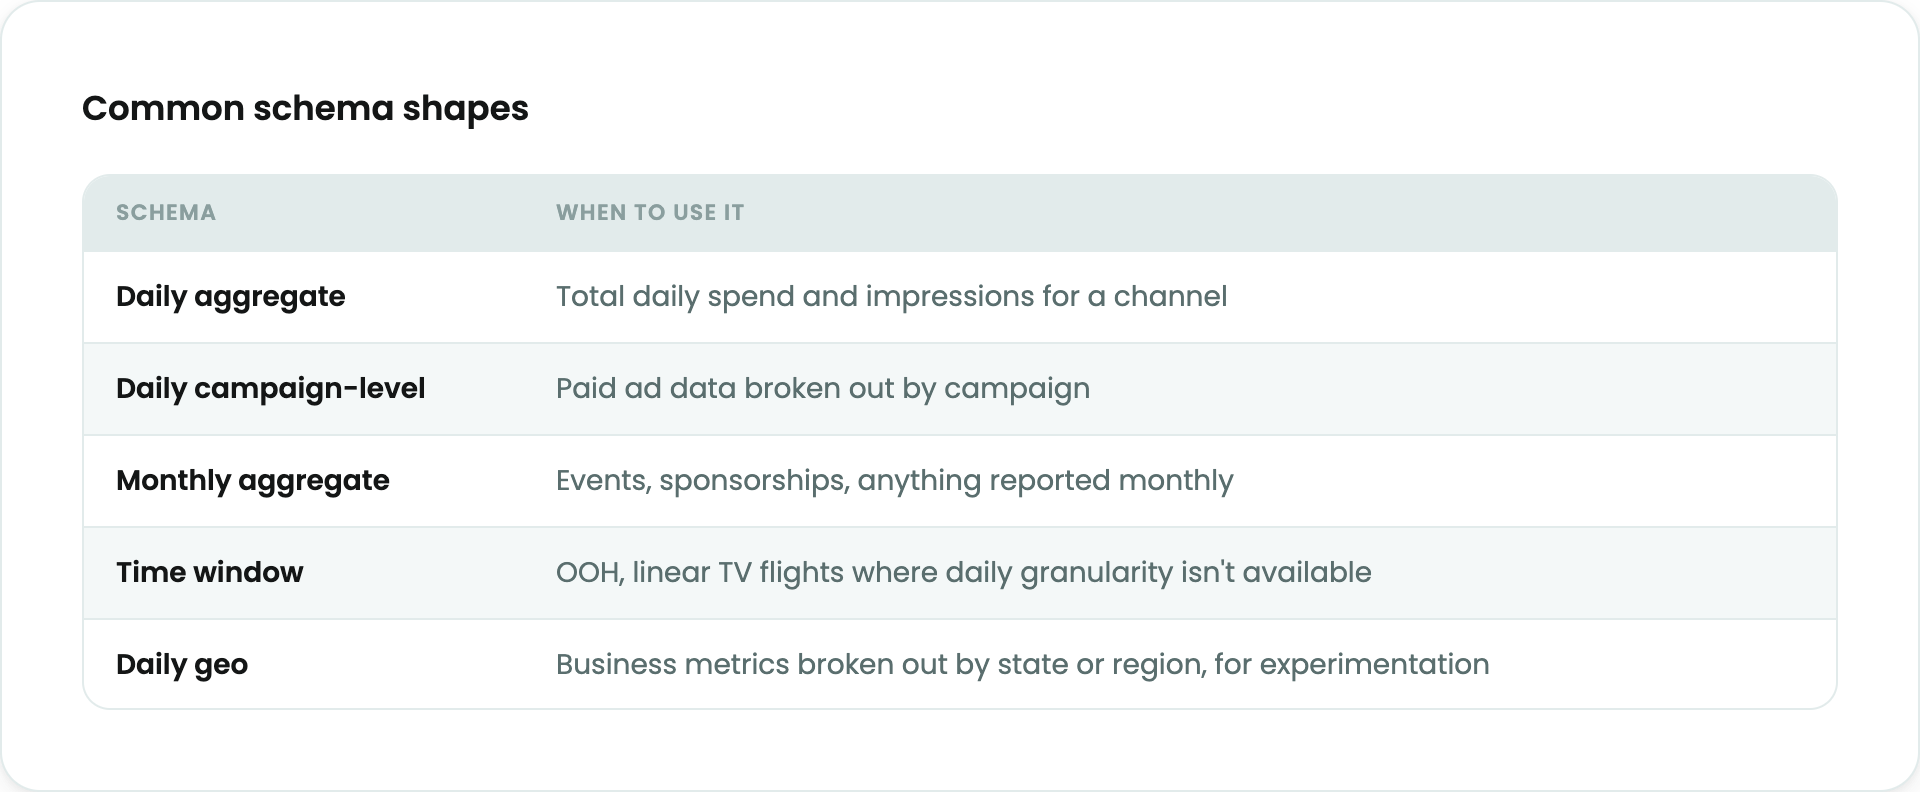
1. Daily aggregate time series data
Use when you have daily data points for a marketing channel or a company key metrics.
A. Account level data with spend
Commonly used for paid ads when the data is not broken out by campaign.
date | impressions | spend |
2025-01-01 | 151222 | 2500.00 |
2025-01-02 | 132621 | 2100.00 |
2025-01-03 | 165780 | 2750.00 |
2025-01-04 | 149390 | 2620.00 |
… | … | … |
B. Account level data without spend
Used for organic channels like SEO and organic social.
Unique by: date
date | impressions |
2025-01-01 | 98002 |
2025-01-02 | 105421 |
2025-01-03 | 101879 |
2025-01-04 | 96455 |
… | … |
C. Business KPIs / Target metrics
Used for business KPIs like sign-ups, purchases, app installs, leads submitted, etc. Provide a region dimension for this data (5. Geography-level data) as that will enable experimentation. If geo data is not available, please work with your Growth advisor on steps to capture that data going forward to enable experimentation.
Unique by: (region, date)
region | date | sign_ups |
CA | 2025-01-01 | 222 |
FL | 2025-01-02 | 195 |
TX | 2025-01-03 | 267 |
CA | 2025-01-04 | 241 |
... | … | … |
2. Daily campaign-level time series data
Use this to share ad data broken out by campaign or a similar dimension. Feel free to include additional dimensions that may be useful for grouping your data into sub-channels (e.g. advertising channel type for Google or publisher platform for Meta).
Facebook example
Unique by: (date, campaign_name)
date | campaign_name | impressions | spend |
2025-01-01 | campaign_a | 50000 | 1200.00 |
2025-01-01 | campaign_b | 30000 | 800.00 |
2025-01-01 | campaign_c | 20000 | 500.00 |
2025-01-01 | campaign_d | 51222 | 1150.00 |
2025-01-02 | campaign_b | 45000 | 1100.00 |
… | … | … | … |
Google Search example
Unique by: (date, channel_type, campaign_name)
date | channel_type | campaign_name | impressions | spend |
2025-01-01 | SEARCH | branded_search | 50000 | 1200.00 |
2025-01-01 | SEARCH | non_branded_search | 30000 | 800.00 |
2025-01-01 | SEARCH | retargeting_display | 20000 | 500.00 |
2025-01-01 | SEARCH | lookalike_prospecting | 51222 | 1150.00 |
2025-01-02 | SEARCH | branded_search | 45000 | 1100.00 |
… | … | … | … | … |
3. Monthly aggregate time series data
This resembles daily aggregate time series data, only with one row per month rather than one row per day. The date column should reference the first day of the relevant month.
We show an example of a channel with registrations and spend, like Events, but you can include whatever metrics you’d like for modeling.
Unique by: month_start_date
month_start_date | registrations | spend |
2025-01-01 | 194 | 12500.00 |
2025-02-01 | 37 | 32100.00 |
2025-03-01 | 47 | 2750.00 |
2025-04-01 | 103 | 12620.00 |
… | … | … |
4. Time Window Data (aggregated periods)
Use this when you have summary data over a longer time period, but you don’t have specific daily values. This is common with data sources like out of home and linear TV.
A. Total Numbers Over a Period
In this example, total_impressions and total_spend represent the sum total of all impressions and spend within the time period.
Unique by: n/a
start_date | end_date | total_impressions | total_spend |
2025-01-01 | 2025-01-07 | 700000 | 17000.00 |
2025-01-08 | 2025-01-14 | 845000 | 20100.00 |
… | … | … | … |
B. Daily Averages Within a Time Window
In this example, daily_impressions and daily_spend represent the assumed impressions and spend for each individual day within the time period.
Unique by: n/a
start_date | end_date | daily_impressions | daily_spend |
2025-01-01 | 2025-01-07 | 100000 | 2500.00 |
2025-01-08 | 2025-01-14 | 120714 | 2870.00 |
… | … | … | … |
5. Geography-level data
When sharing data broken out by geographical region, each region should have complete data coverage for the time period (i.e. each date in the dataset should have data for every region). You’ll want to use this format when sharing business KPI data in a format amenable to experimentation.
The examples show daily time series data for the entire year of 2025 for both US and CA regions. The first example is for a marketing channel, and the second example is for a business KPI.
If Paramark is building a hierarchical model, the locations referenced by the “region” column should usually match the regions in your model. If you have multiple sub-regions within each region being used for a hierarchical model, please share the mapping of region and sub-region with us separately. See Hierarchical vs non-hierarchical models for more information.
Marketing channel example
Unique by: (region, date)
region | date | impressions | spend |
US | 2025-01-01 | 151222 | 2500.00 |
US | 2025-01-02 | 132621 | 2100.00 |
… | … | … | … |
US | 2025-12-30 | 3271 | 1200.00 |
US | 2025-12-31 | 8217 | 1900.00 |
CA | 2025-01-01 | 23218 | 3500.00 |
CA | 2025-01-02 | 21762 | 1700.00 |
… | … | … | … |
CA | 2025-12-01 | 33376 | 3900.00 |
CA | 2025-12-31 | 47628 | 4500.00 |
Business KPI / target metric example
Unique by: (region, date)
region | date | opportunities_created |
US | 2025-01-01 | 87 |
US | 2025-01-02 | 43 |
… | … | … |
US | 2025-12-30 | 26 |
US | 2025-12-31 | 62 |
CA | 2025-01-01 | 53 |
CA | 2025-01-02 | 59 |
… | … | … |
CA | 2025-12-01 | 37 |
CA | 2025-12-31 | 19 |
6. Media or post-level data
For some channels, you will have data about the total impressions or views a particular piece of media received, but you don’t have data for the specific number of impressions received on a specific date. For example, on Instagram Organic, you might know that a post created on 2025-01-01 received 100,000 impressions, but you won’t know how many of those impressions happened on that day compared to the following days. For this case we support media-level data formatted in a similar fashion as daily aggregate time series data:
Unique by: URL
date | impressions | URL |
2025-01-01 | 151233222 | |
2025-01-01 | 13221 | |
2025-01-10 | 1659126780 | |
… | … | … |
Data Types
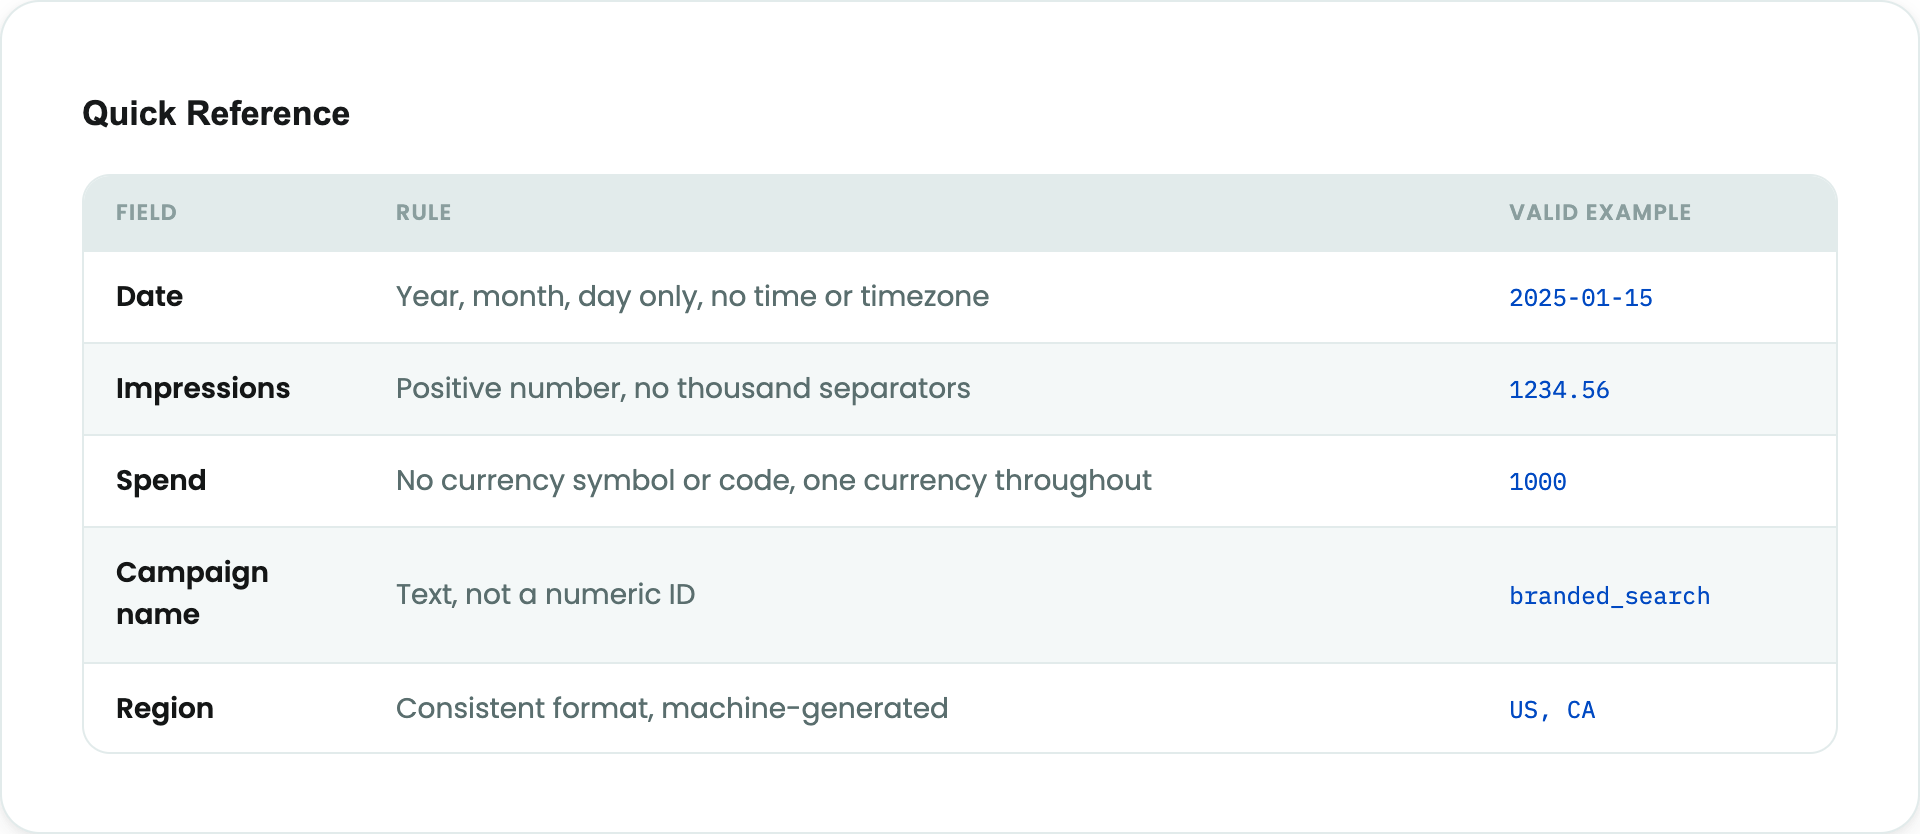
Date
Must have year, month, and day
Must not contain time or timezone information
Must use a single consistent format within a table or file
For monthly data, use the first of the month (e.g. “2025-05-01” meaning “the entire month of May”)
Acceptable date formats:
yyyy-mm-dd (e.g., 2025-01-15)
yyyy/mm/dd (e.g., 2025/01/15)
dd-mm-yyyy (e.g., 15-01-2025)
dd/mm/yyyy (e.g., 15/01/2025)
mm-dd-yyyy (e.g., 01-15-2025)
mm/dd/yyyy (e.g., 01/15/2025)
Example | Pass / Fail | Comments |
2025-01-15 | ✅ | |
15/01/2025 | ✅ | |
15/1/25 | ❌ | Does not match acceptable date format |
15 Jan 2025 | ❌ | Does not match acceptable date format |
15/1 | ❌ | Does not have year |
1/2025 | ❌ | Does not have day |
2025-01-15T00:00:00z | ❌ | Contains time information |
2025-01-15 00:00:00 -07:00 | ❌ | Contains time and timezone information |
Impressions and Key Metrics
Must be positive numbers
Must not contain thousand separators
May use
.(period) as decimal separator if needed
Example | Pass / Fail | Comments |
1000 | ✅ | |
1234.56 | ✅ | |
1,000 | ❌ | Contains thousand separator |
-123 | ❌ | Is a negative number |
(123) | ❌ | Not a valid number |
123k | ❌ | Not a valid number |
Spend
Must not include currency symbols or codes
Must use the same currency across all data sources
Must be a positive number
Must not include thousand separators
May use
.(period) as decimal separator if needed
Example | Pass / Fail | Comments |
1000 | ✅ | |
1234.56 | ✅ | |
1,000 | ❌ | Contains thousand separator |
-123 | ❌ | Negative number |
(123) | ❌ | Not a valid number |
123k | ❌ | Not a valid number |
$ 100 | ❌ | Contains currency symbol |
USD 100 | ❌ | Contains currency code |
Campaign Name
Must be text
Example | Pass / Fail | Comments |
Branded Search | ✅ | |
non_branded_search | ✅ | |
low-cost-campaign | ✅ | |
2025-targeted-campaign | ✅ | |
202728 | ❌ | Is a number |
Region / location
Must be the code or name of the country, state, region, or city but need not conform to a specific naming scheme like ISO-3166.
Must use a consistent format throughout (e.g., US, USA, or United States).
Must be machine-generated (not free text entered by users).
Should usually match the regions in your model. See Hierarchical vs non-hierarchical models for more information.
Example | Pass / Fail | Comments |
US | ✅ | |
USA | ✅ | |
United States | ✅ | |
CA | ✅ | |
California | ✅ | |
ISO506 | ❌ | Not a country, state, region, or city |
Want to learn more about sharing your data? Check out other Paramark data sharing articles here